Explore the Story of Oregon’s Forests
Oregon Forest Facts tells the story of Oregon’s forests through data, charts and graphs. It fills a need for accurate and current information about Oregon’s forests in an easy-to-access format.
Oregon Forest Facts tells the story of Oregon’s forests through data, charts and graphs. It fills a need for accurate and current information about Oregon’s forests in an easy-to-access format.


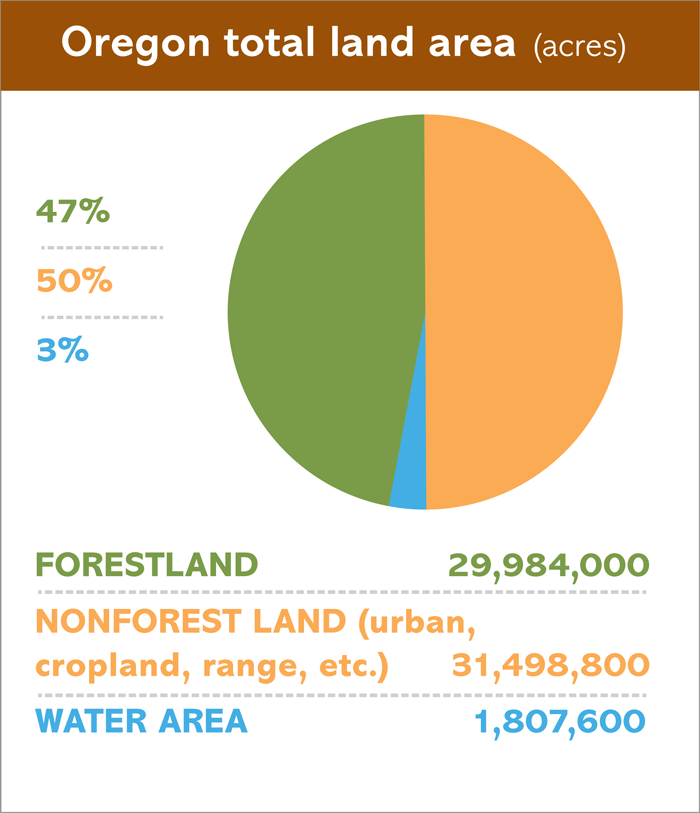
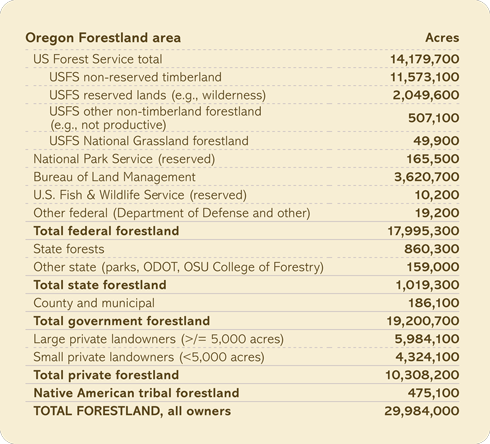
Nearly half of Oregon is forestland. About 80 percent of this forestland is classified as “timberland.” Timberland is forestland that can productively grow commercial grade timber. It excludes forestland with low growth and reserve areas where logging is restricted, such as wilderness areas and national parks.

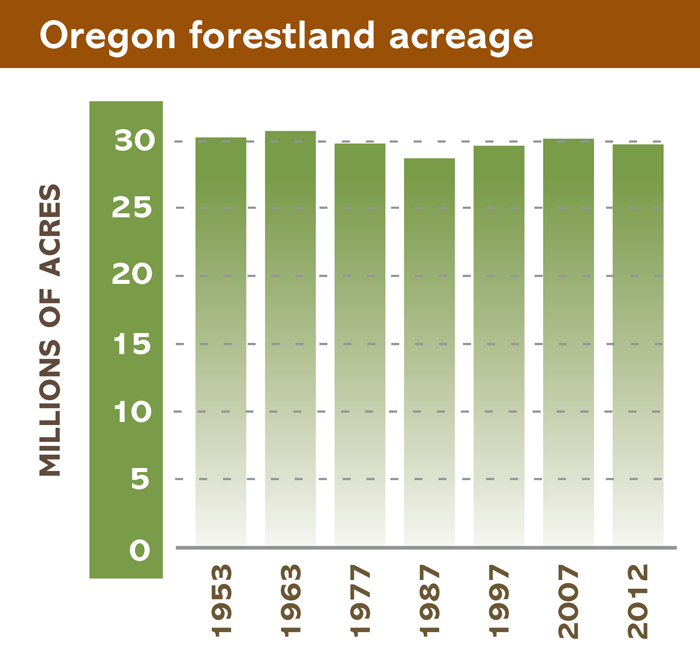
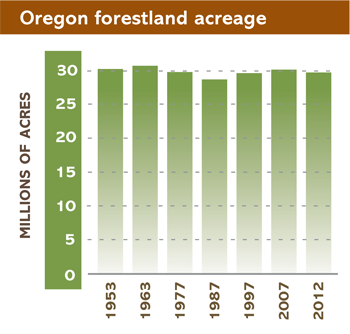
The amount of total public and private forestland in Oregon has held mostly steady at about 30 million acres for more than 60 years. In fact, it’s estimated to have been about 30 million acres in the 1600s, as well. Oregon has done remarkably well in protecting forests, farms and rangeland from development. In fact, 97 percent of all non-federal land in Oregon that was in resource land uses in 1974 remained in those uses in 2014. When forestland is lost today, it tends to happen because of residential or commercial development. Between 1974 and 2014, about 247,000 acres of private Oregon forestland were converted to other uses, mostly to low-density housing. However, Oregon’s loss was less than half the loss seen in Washington state over the same period. That’s due largely to differences in Oregon’s land use and forest practices laws, which work in tandem to keep forestland and farmland in forest and farm uses.
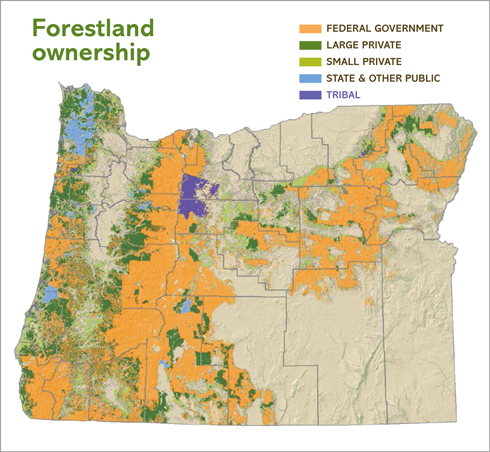
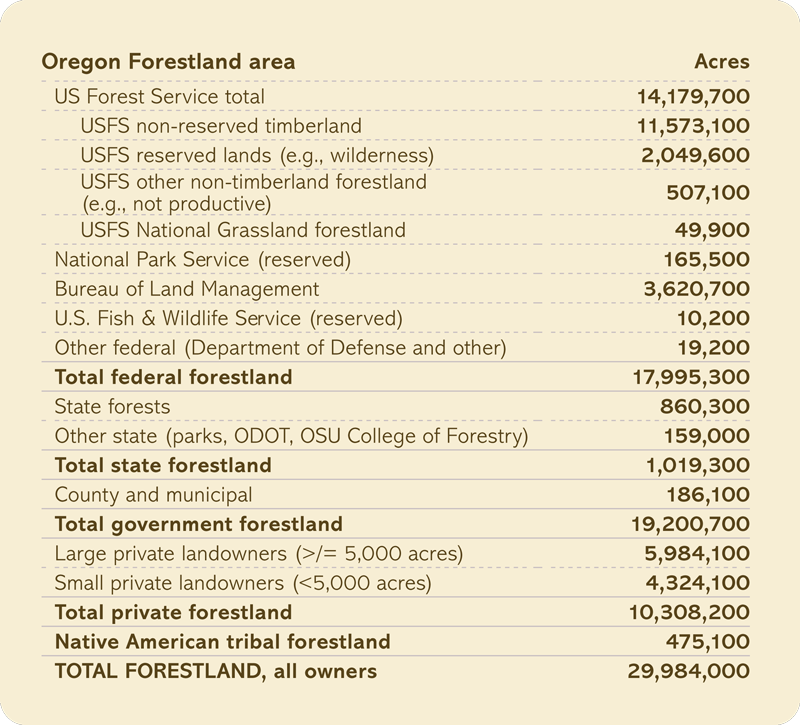
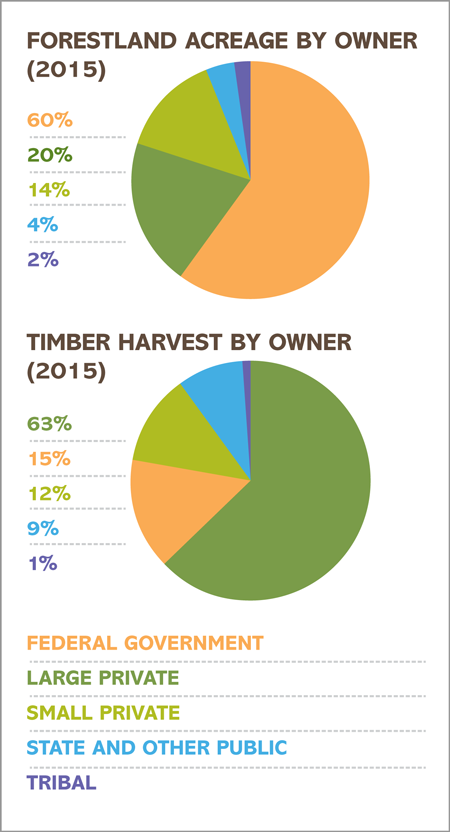
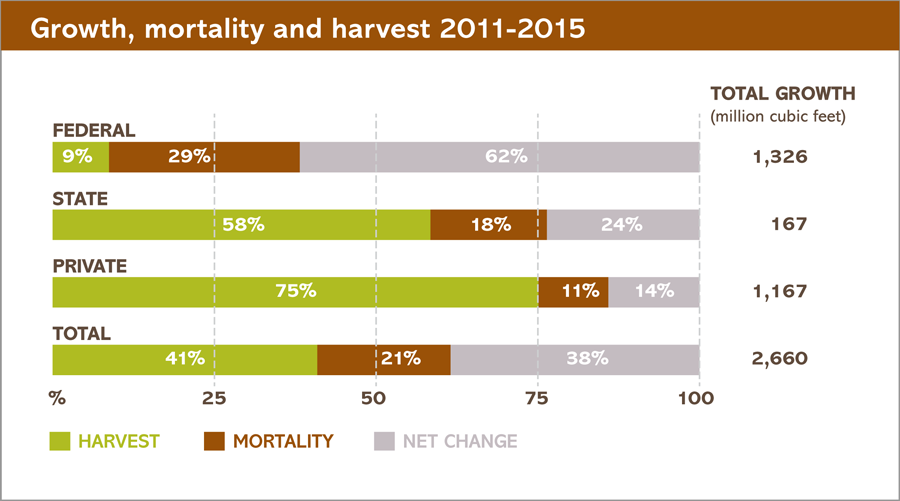
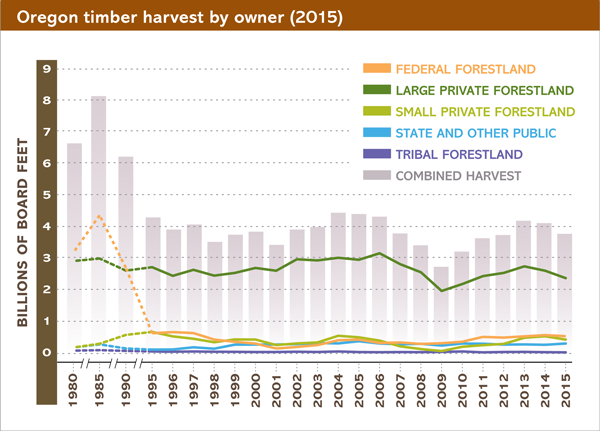
While the federal government manages most of the forestland in Oregon, only a fraction of Oregon’s timber harvest happens on federal land, and most of that is from thinning. About 75 percent of the total state harvest comes from private timberlands.

From the end of World War II until 1989, timber harvests in Oregon generally ranged from 7 to 9 billion board feet annually. Between 1989 and 1995, timber harvest on federal lands dropped about 90 percent, caused mainly by environmental litigation, listing of the northern spotted owl and a number of fish as threatened species, and related changes in federal management emphasis. Harvests from private lands have remained relatively stable, other than when the Great Recession (2007-09) and the collapse of the housing market brought a severe contraction in the U.S. demand for lumber. Consequently, Oregon’s timber harvest reached a modern-era low in 2009, the smallest harvest since the Great Depression in 1934. By 2013, the harvest had rebounded to 4.2 billion board feet, roughly prerecession levels.
On Oregon’s private forestland, where most timber harvest happens in the state, the amount of wood harvested each year is about 75 percent of the annual timber growth. About 11 percent of the growth is offset by trees that die from causes such as fire, insects and disease. On federal lands, only about 9 percent of the annual timber growth is harvested each year. The amount of timber that dies offsets annual growth by 30 percent. The remainder of the growth, 62 percent, adds to the volume of standing timber in those forests. High net change in growth isn’t always beneficial, however. For example, in federal ponderosa pine and mixed conifer forests in eastern and south central Oregon, high net growth has created unusually dense forests with stressed trees that are more prone to insect infestation, disease and uncharacteristically severe fire.

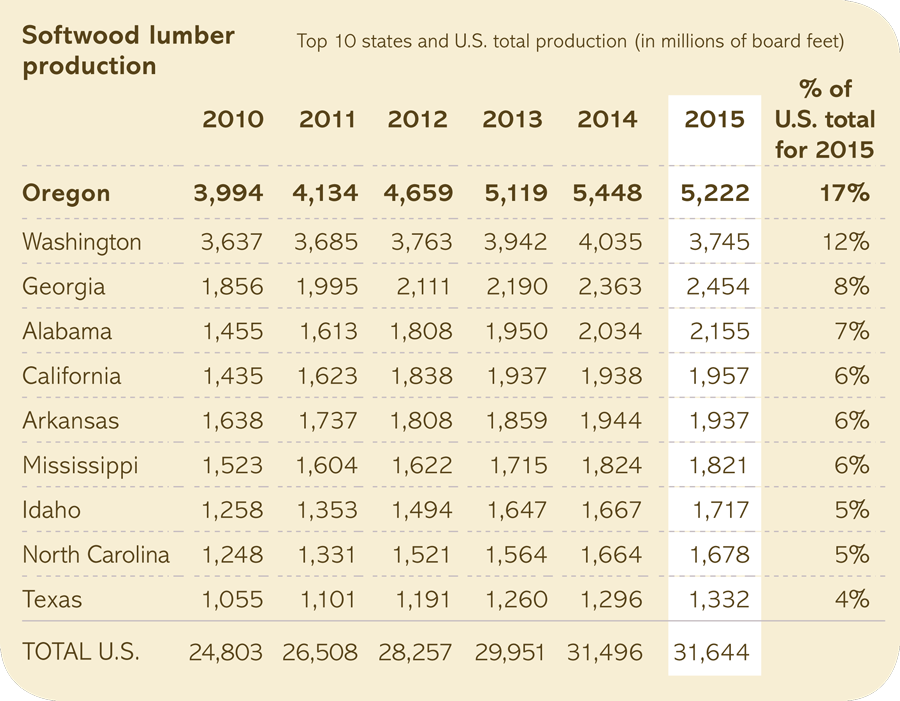
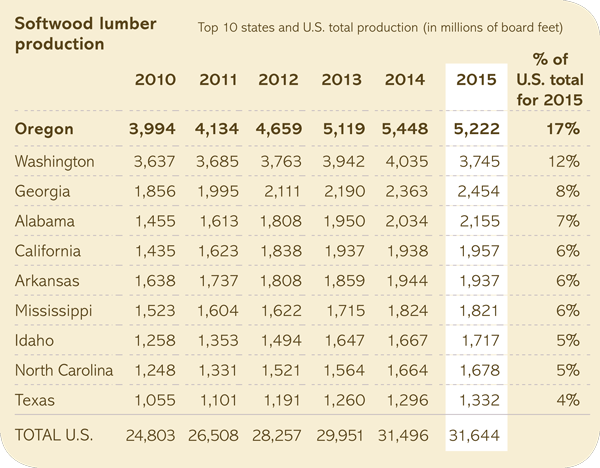
Oregon has led the nation in softwood lumber production for many years. Oregon’s lumber output of 5.2 billion board feet in 2015 accounted for about 16.5 percent of total U.S. production. That’s an increase of 36 percent from the recessionary low in 2009. However, Oregon sawmill output in 2015 was only about 70 percent of the pre-recessionary high in the early 2000s.
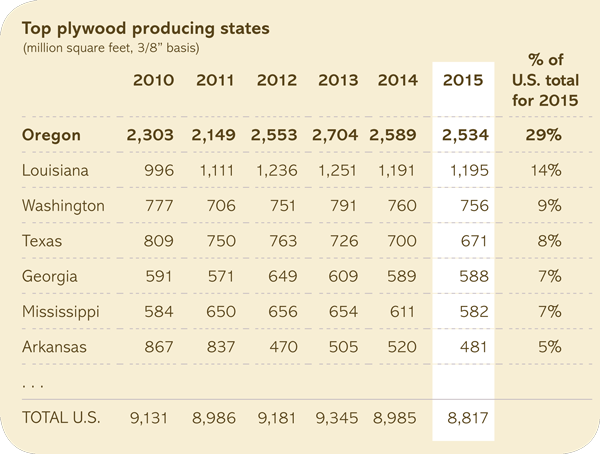
Oregon dominates U.S. production of softwood construction plywood. In fact, Oregon accounted for about 29 percent of total U.S. plywood production in 2015, up from 25 percent in 2010. Through 2015, 15 plywood mills were operating in Oregon of 53 total nationwide. A Springfield mill that was destroyed by fire in 2014 reopened in 2016. Overall, U.S. plywood production has been challenged by cheaper strandboard products that have taken market share in some uses. Oregon has no mills that make strand board. Yet plywood is still a significant business that has rebounded from its recessionary low in 2009.
Streams originating on forestlands supply water for Oregonians to drink, use in their homes and businesses, irrigate their fields and run industrial processes. Forest soils provide natural filtration to keep streams clean and water quality high. Some 35 municipal water systems in Oregon source their drinking water supply from forested watersheds. More than 30 of those watersheds include actively managed lands that employ modern timber harvest and resource protection methods.
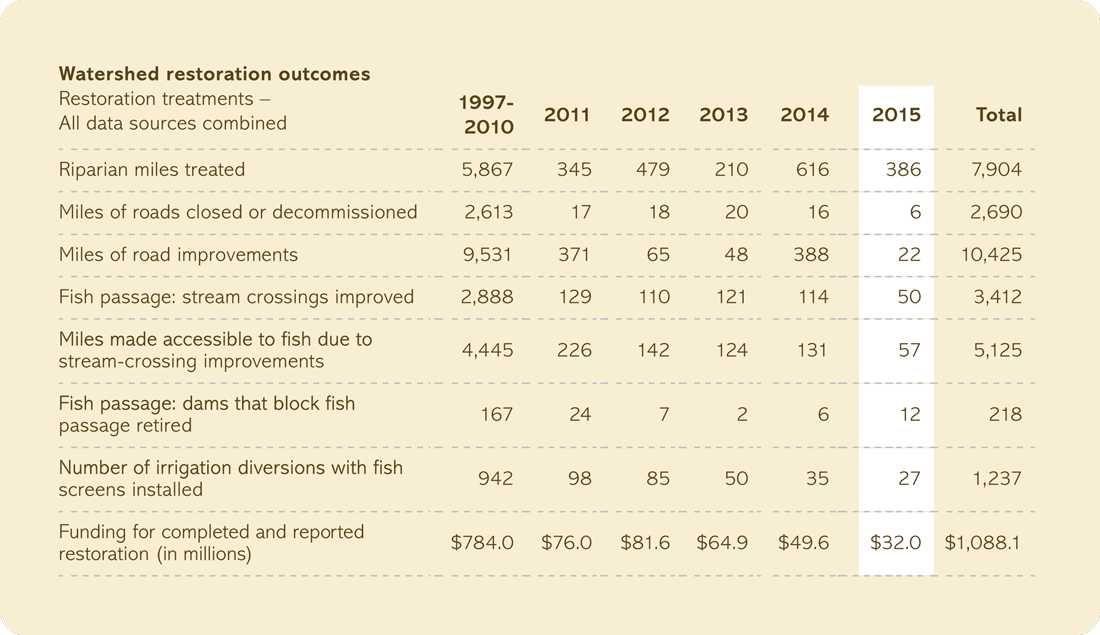
In response to listings of salmon species under the federal Endangered Species Act, Oregon lawmakers joined with landowners in 1997 to create the Oregon Plan for Salmon and Watersheds. The Oregon Plan seeks to restore salmon runs, improve water quality and achieve healthy watersheds statewide through the joint efforts of government, landowners and citizen volunteers. The plan is unique among state protection plans for its emphasis on landowners voluntarily exceeding regulations, and for its engagement of communities to restore their watersheds. Combined efforts have restored more than 7,900 miles of stream banks and opened an additional 5,100 miles of streams to fish through stream-crossing improvements.
The Oregon Plan is one part of a three-pronged effort to protect water and fish habitat that includes the state’s forest practice rules and land use laws, which work to keep forestland from being converted to other uses that are less compatible with quality fish habitat. Since 1997, more than $1 billion has been invested in watershed restoration projects in Oregon.

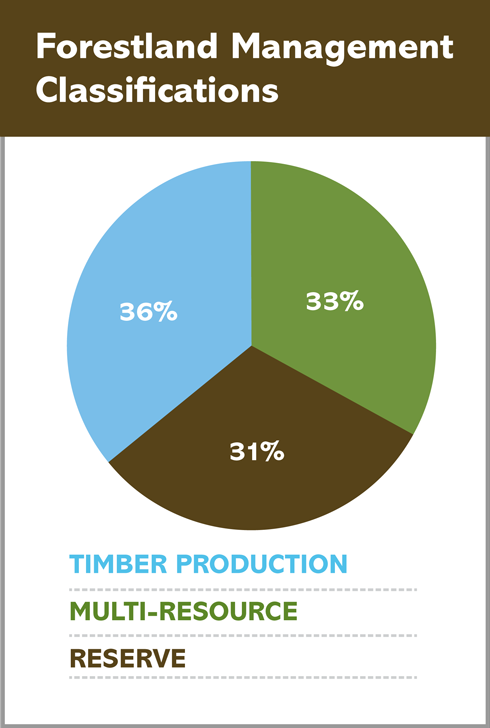
Oregon’s forests are managed to reflect the interests and practices of different owners. A study by the Oregon Department of Forestry showed that in general, the forestland base is managed for three primary purposes.
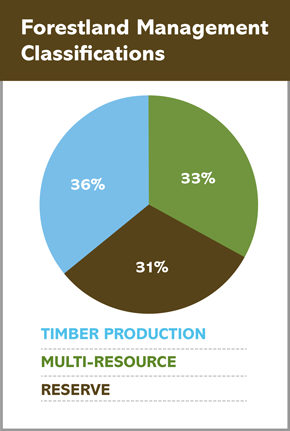
Forests managed mostly for income or timber production by large and small private owners and tribes. Private forests, managed under the Oregon Forest Practices Act to protect non timber values, supply about three quarters of the annual statewide timber harvest.
Forests managed for multiple uses, including recreation, water, wildlife habitat and timber production. These forestlands are primarily in public, tribal and small private ownership. When harvest occurs on state and private land, it also is subject to the Oregon Forest Practices Act.
Forests managed and conserved mostly for environmental or cultural reasons, with limited timber harvest. These forests are largely owned by the federal government and may be set aside as parks or wilderness areas, or as riparian, old-growth or endangered species habitat.
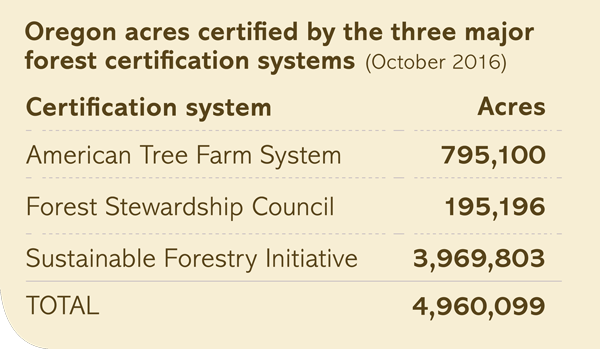
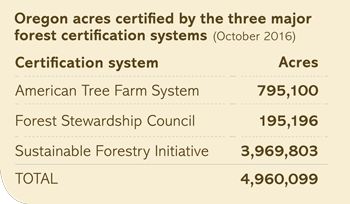
Oregon forest landowners meet some of the strictest environmental standards in the world through compliance with the Oregon Forest Practices Act. Yet they may choose to meet additional standards to gain recognition from independent, third-party forest sustainability certification systems. America’s three largest certification systems are the American Tree Farm System (ATFS), Forest Stewardship Council (FSC), and the Sustainable Forestry Initiative (SFI). Forest certification gives wood product consumers, architects, engineers and builders an added level of assurance that the products were produced using responsible and sustainable forestry practices.
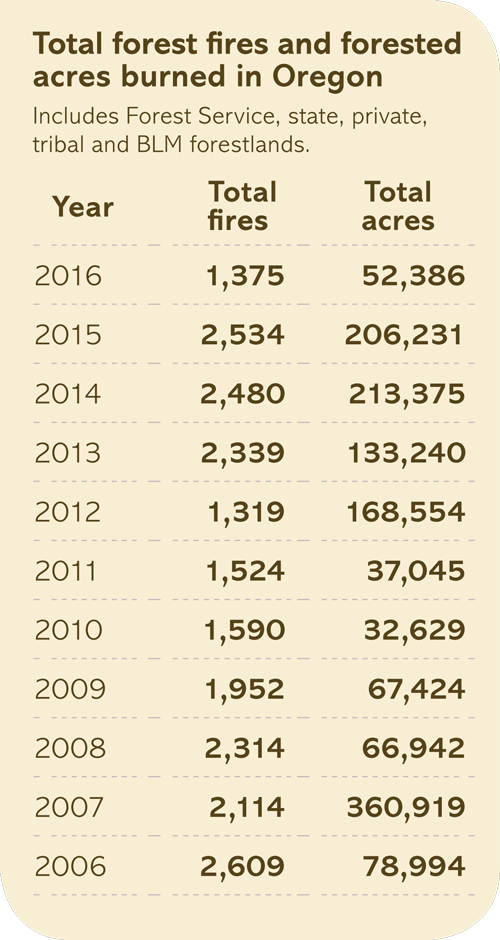
For the first time since 2011, the total acres burned in 2016 was less than the average for the previous 10 years. The costs of fighting large fires on state-protected lands was also down in 2016. It dropped below the 10- year average of $33.8 million to $18 million.
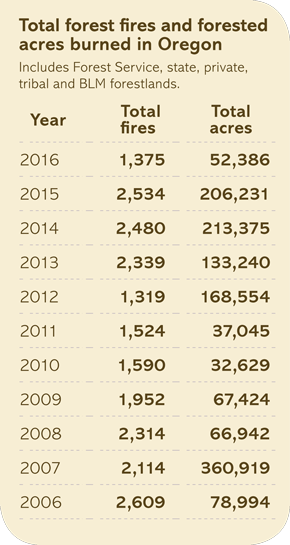
One noteworthy fact of the 2016 fire season is that human-caused fires greatly exceeded fires caused by lightning. Human-caused fires accounted for 84 percent of the fires and 93 percent of the acres burned in 2016. This is cause for public concern. Causal factors include members of the general public not following seasonal restrictions on activities such as mowing and pile burning. Arson is also to blame. Wildfires started by unattended campfires and other human activities are preventable. The nonprofit organization Keep Oregon Green works to reduce the number of human-caused wildfires in Oregon through awareness and education.
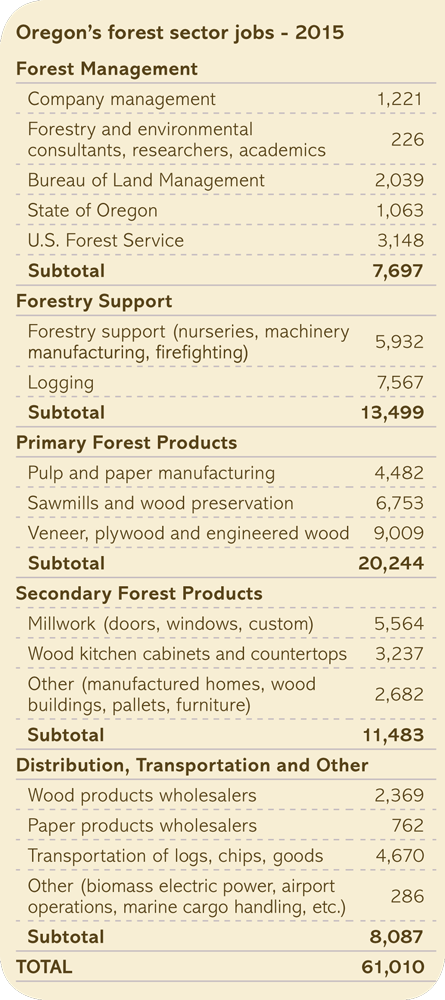
Oregon’s forest sector includes a wide variety of employment, from forestry, logging, millwork and cabinetmaking to engineering, hydrology, business management and academic research. Economists estimate that each million board feet of timber harvested creates or retains about 11 forest sector jobs.
Here’s a rundown of Oregon’s forest sector jobs by type of employment in 2015:
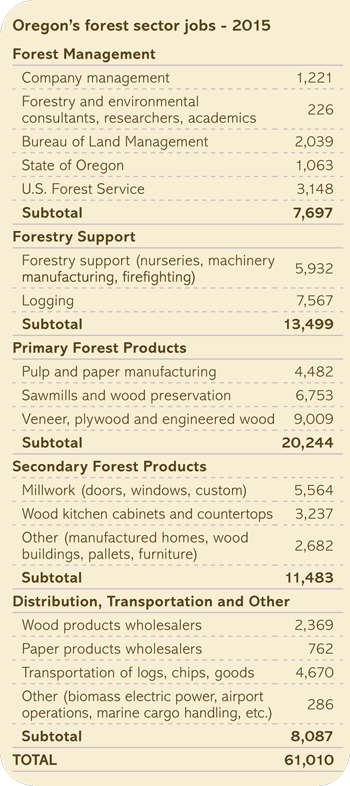
Timber harvest and forest sector jobs data is from 2015. Wood processing data is from 2016. Jobs data is from Oregon Employment Department. Ownership, harvest data and map provided by the Oregon Department of Forestry.